|
!!! Every benchmark we do leverages the Scalebench platform, which installs and runs well known benchmark suites and tools in an automated fashion, and processes the results into graphs and reports (as seen below) for analysis. |
AWS is well known for it’s EBS (elastic block storage) offering, which effectively separates (both physically and functionally) the storage component of a VM from the processing component. This means that it’s trivial to mix and match front end processing systems, allowing a user to upgrade/downgrade/pause an instance seamlessly with storage waiting to be re-attached. This storage can be found on separate instances using the AWS custom built nitro system. Multiple copies of data for a given EC2 instance are read/written to within the same availability zone. Based on their details page we are going to assume it’s a one (or more) disk master copy read/write, and there are other disk (set) copies on other servers that are written to asynchronously, and not used for reading (that would be the safest way to do it and avoid getting into the weeds of architecting a synchronous cluster based storage system).
So what is the other option? The old fashioned way of having one or more disks physically attached to your server. AWS does have this, they call it ‘instance store’, and you’ll see on the instances types page, any listing with NVMe SSD, supports local disk. However, beware, for the AWS version of local disk is ‘ephemeral’, which means if the instance is either stopped, or terminated, you lose the data (rebooting is okay). This is likely due to their overall architecture philosophy where once an instance is stopped, the front end processing VM (included any attached disks) is thrown back into the pool for other users. The big advantage local storage has, is the close proximity and thus low latency of interactions, and so they certainly should perform better.
Why don’t they offer a class of servers with local storage AND durable local storage? We’ll just chalk it up to business reasons.
so let’s compare the following options and see how they perform,
-
- EBS SSD general iops (about 3k for a 1TB volume)
- EBS SSD provisioned iops (about 50k for a 1TB volume)
- NVMe SSD local disk (one disk raid 0)
- NVMe SSD local disk (two disks striped raid 1)
* you would generally never run a local disk as raid 0 (otherwise you’d risk losing your data on failure), but it’s useful to how a single disk performs for the active workload and how multiple disks can improve performance.
more details can be found by viewing the report.
Specs are the following,
M5.8xlarge / M5d.8xlarge
-
- 32 cores / 3201.76 mhz / Intel(R) Xeon(R) Platinum 8175M CPU @ 2.50GHz
- L1d: 32 L1i: 32 L2: 1024 L3: 33792
- RAM: 123.16 GB / swap: 0.00 GB / hugepages: 0.00 GB / hp size: 2.00 MB
- (m5d.8xlarge local disk) 2 X 558.80 GB, ext4
- (m5.8xlarge EBS) 1023.00 GB, ext4
- Amazon Linux AMI 2018.03 35.164.220.8
Testing Parameters
We use the Scalebench platform to leverage Sysbench benchmarking tool.
-
- Sysbench benchmark suite
- 3 X 60 second runs (yes, pretty short runs. more on this below)
- disk – seqrd, seqwr, rndrd, rndwr (default settings)
- total file size of 500GB ( >> 128GB memory)
- 16KB requests
- Sysbench benchmark suite
Results
We do 4 separate tests read/write in sequential/random fashion. Before we start to analyze the results, there are a few AWS specific limits to keep in mind, which are detailed here and here. Essentially AWS has both I/O and throughput limits for EBS and specifics depend on the volume type.
-
- EBS 3k – 3,000 iops | 250MB/sec throughput
- EBS 3k – 50,000 iops | ~800MB/sec throughput
- EBS per instance (m5.8xlarge/ m5d.8xlarge) – 30,000 iops | ~850MB/sec*
* and so the instance type can limit the iops and throughput regardless of the EBS storage settings.
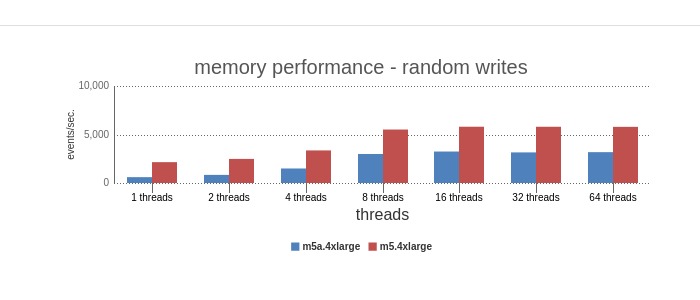
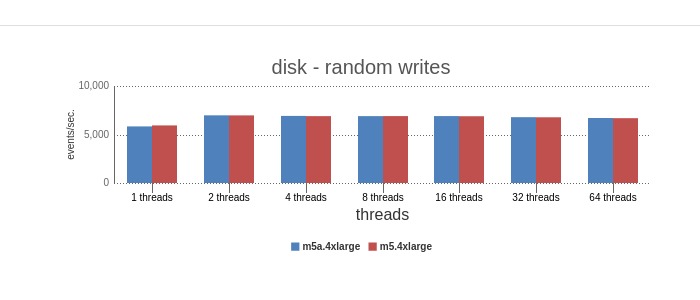
Random Writes – Because it’s a random access pattern, each piece of data will likely reside on a different block, and thus generally an I/O per request. So iops becomes the limiting factor. The graph shows this to be quite true for EBS general iops which tops out at about 3,000 iops for 2+ threads. the EBS provisioned iops improves with more threads, however tops out at 32+ threads and begins to degrade due to thread contention. Also the max iops reached was ~ 23k iops, somewhat lower than the instance max of 30k iops. The local disk results both reach max capacity much more quickly at 4+ threads as there is no imposed limit, and due to low latency of local disk. The single disk vs. raid 1 (two copies), have the same results, as raid1 has to write a copy of the data to each disk. 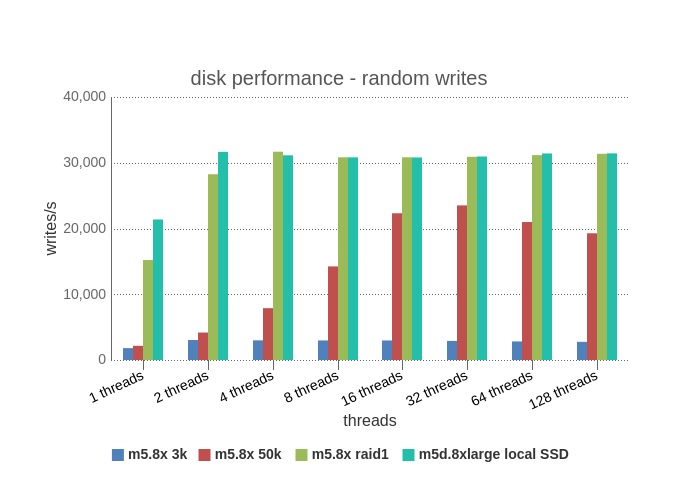
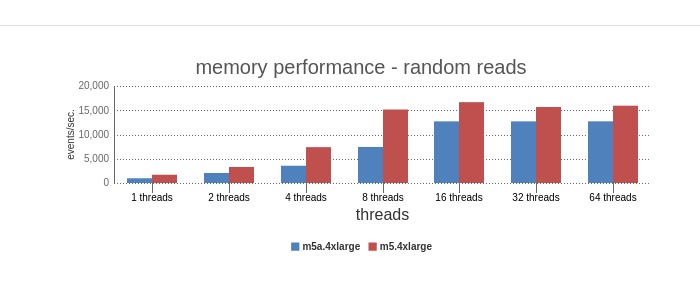
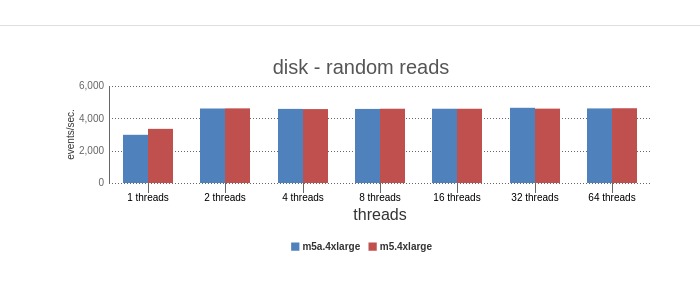
Random Reads – Again, for the same I/O per request reason, the limiting factor is likely to be iops for EBS, and we see that the general characteristics are similar to the Random Reads graph. EBS 3K is limited quickly at 2+ threads and maxes at ~ 4k (there may be some bundling in the physical writes), EBS 50k increases capacity to max out at 16+ threads and hits a max of 40k iops (limit should be 30k max of the instance). Again bundling of physical writes by about the same factor. The local disk runs 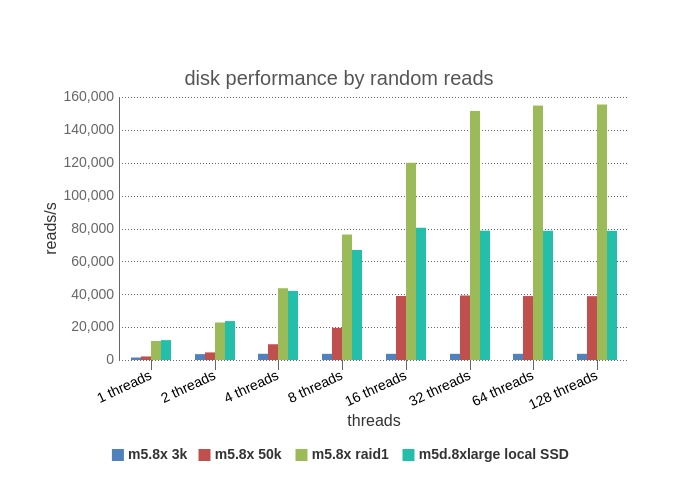
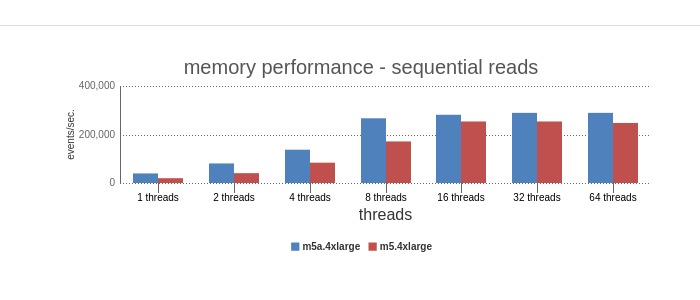
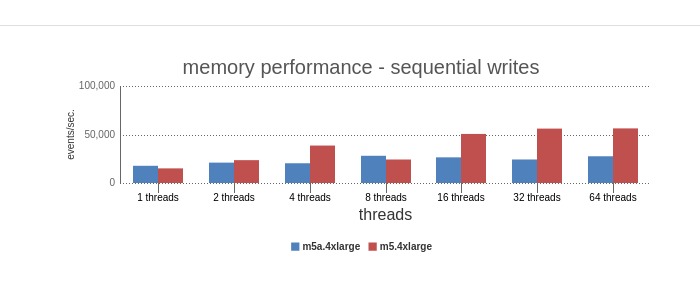
Sequential Writes – Sequential access is fundamentally different, requests can be made to the same block on disk and so subsequent requests are cached for reads to the same block. Additionally, the process then moves on to query adjacent blocks which are likely also cached in a read-ahead, journal file system. So many sequential requests can result in one block request. Instead of sequential access hitting the iops ceiling, it hits the thoughput ceiling. We can see that EBS 3k run is steady at ~16K iops for all threads, and you’ll find that 16,000 iops * 16k per request ~ 250MB/sec, the throughput ceiling for EBS 3K. For the local cases, throughput is also a limiting factor, although it’s the throughput of the disk(s) themselves with no artificial limit and so the results are flat for all thread runs. Raid1 and single disk results are the same as raid1 needs to write to both disks. 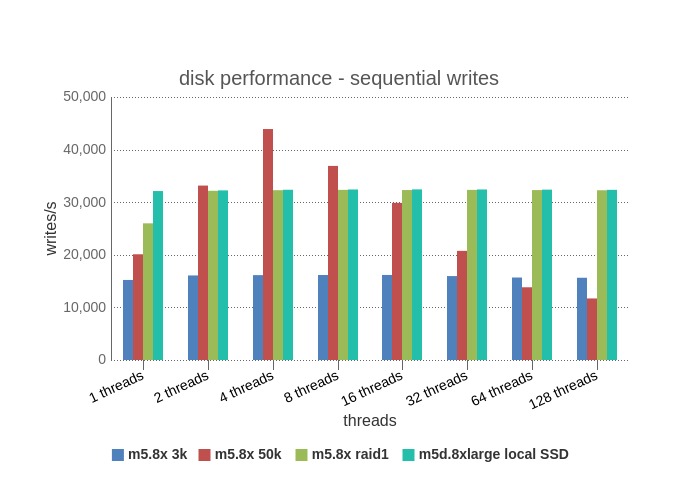
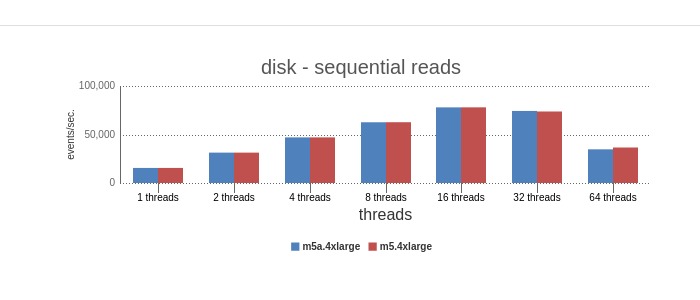
Sequential Writes – uh-oh a big red line through it. That can’t be good. When doing these benchmarks, we did very short runs (60 secs). Why so short? In the interest of cost savings, even with 60 seconds per run, a disk test 3 times per combo for 1-128 threads for the 4 access options takes about 6 hours per instance. With the other 3 cases, there were minimal effects, but in the case of sequential reads, there were cached reads that skewed the results the first 5-10 seconds. Below is the results with first 10 seconds cut. 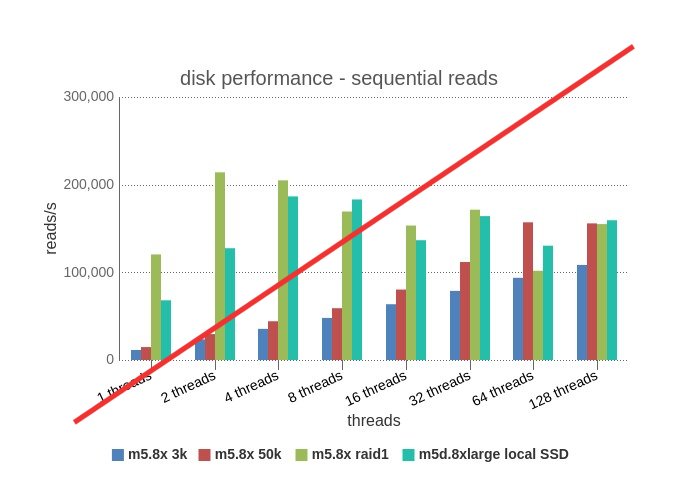
Now we have proper data, and you can see, EBS 3k again tops out quickly at ~16,000 iops / 250 MB/sec. EBS 50k doesn’t reach it’s max until 64+ threads, topping out at 50k iops but really, 50k iops * 16kb = 800 MB/sec, which is probably the true limiting factor in this case. Both local disk cases start out vastly better due to low latency and the raid 1 performs 2x+ better than the single disk for lower thread values, as there are 2 disks to serve reads. As threads increase, thread contention brings the results closer together. 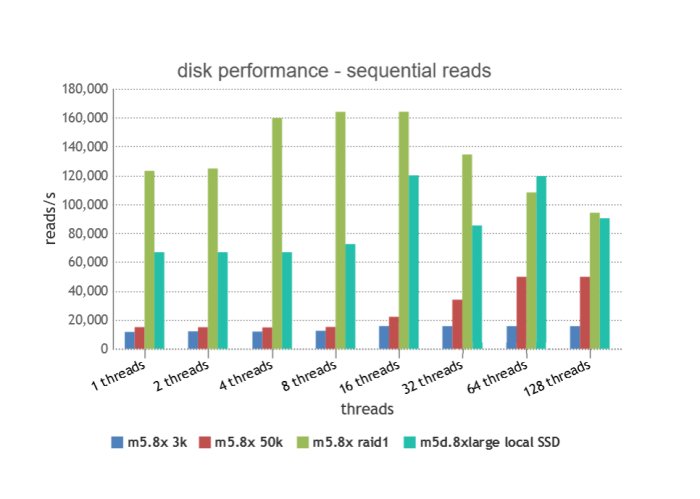
Takeaways
- the local disk options are vastly better at random access than EBS, due to low latency and iops being a limiting factor. Although most applications try to avoid random reading, it’s hard to avoid completely and so good performance in this area is a big plus. Sequential reads are also vastly better than EBS, mainly due to rate limiting of EBS, specifically the throughput. Generally you are going to get full, unrestricted access to a local disk with much lower latency than network storage (EBS).
- Raid1 is (not surprisingly) up to 2x better for reads than the single disk. Writes are the same due to needing to write to both disks. However on larger system, you can have 4+ disks and do raid10 (mirrored striping) which would give improvements to writes as well.
- Unfortunately as mentioned at the start, local disk options are ephemeral and will lose your data on a terminate/stop of the instance. Even so, it might be worth considering a high availability architecture to allow using it.
- EBS 50K is certainly more performant than 3K, although you generally need to get past 4+ threads to see a real difference (e.g. a database). Single threaded processes are not going to be much faster (e.g. a file copy, zip, etc..). EBS 50k was limited by the instance max iops (30k), so generally be aware the instance size also can be a limiting factor on EBS performance.
- It’s possible to raid EBS as well, but keep in mind it’s networked storage and so that will likely be a real bottleneck on any performance gains. Worth a separate test to compare.